|
Advances in Market Segmentation
William D. Neal John Wurst, Ph.D. Marketing Research. A Magazine of Management and Applications
Spring, 2001
For most business firms, locating and effectively targeting unique market segments is both a reality and a necessity in today's competitive market place. Creative market segmentation strategies usually afford the business organization a strategic advantage over their competition and provide marketing efficiencies that greatly improve customer retention and profitability. If a firm can address its markets by way of a creative new vision of how that market is structured and operates, and can uncover the needs and wants of the segments therein, then it has the opportunity to act on that vision to enhance its own profitability, often at the expense of the competition.
Some firms segment their markets a priori - using some known or suspected relevant measure of customers to categorize them into uniform groups, assuming these groups will respond differently to their marketing efforts. Examples include demographic measures, SIC codes, geographic regions, or geodemographic groups like Microvision or PRIZM. However, it is generally acknowledged that the better way to segment a marketplace is through a more data-intensive, post hoc procedure whereby we gather extensive information from a sample of the relevant market and use that information to form rather complex market segments employing cluster analysis or similar algorithms.
From a marketing perspective, the acid test for successful market segmentation is to demonstrate that the derived segments respond differently to variations in the marketing mix. Unfortunately, many market segmentation schemes fail this key test.
Since the 1950's we have typically used cluster analysis and search procedures (AID, CHAID, CART) to develop market segments from customer/survey data. Since about 1995, there have been some interesting new developments in and approaches to market segmentation research. The purpose of this article is to introduce the reader to several of these newer concepts and techniques, comment on their application and utility, and speculate a bit on the future of market segmentation. 1
These newer concepts and techniques include:
* Multidimensional Segmentation
* Artificial Neural Networks
* Latent Class Models
* Fuzzy and Overlapping Clustering
* Occasion-based Segmentation
Multidimensional Segmentation 2
In segmenting markets, most researchers use a single set of basis variables, be they demographics, psychographics, product category-related attitudes, product usage-related behaviors, derived importances from conjoint exercises, latent structures or whatever. However, there is no reason to limit the basis for segmentation to only one type of variable when many criteria actually determine buyers' response to offerings in the category. These criteria are multidimensional, encompassing attitudes, needs, values, benefits, means, occasions, and prior experiences, depending on the product or service category and the buyer.
A segmentation scheme based on only one set of basis variables may limit the utility of the information to the firm because various users of segmentation schemes have different needs. For example, product development managers may want the market segmented on perceived values and benefits sought; marketing communications managers may want the market segmented into groups of buyers with similar needs, desires, or psychographic profiles; and sales managers may want the market segmented on sales potential or profitability.
How multidimensional segmentation works
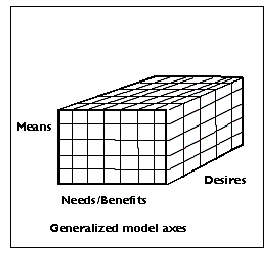
A segmentation scheme based on multiple dimensions, using separate segmentation schemes for each one, is often more useful and more flexible for planning marketing strategy and executing marketing tactics. Thus, one may consider different segmentations on a sample of buyers using different bases, say, performance needs, means (the ability to pay), and desires concerning product-user identity. For example, consider the automobile market. A potential buyer may have the need for a vehicle to carry only two adults and is powerful and reliable, have the means to afford a vehicle in the $20,000 - $25,000 range, and the desire to have unique, styling that makes a statement about their relationship with their vehicle. Another buyer may have the need for economically hauling light loads, the means to purchase in the $15,000 to $18,000 price range, and the desire for a utilitarian, working-vehicle appearance. A segmentation scheme that accounted for all three of those dimensions - needs, means, and desires - is illustrated in Figure 1.
Figure 1
The multi-dimensional segmentation model
 In the past such segmentation schemes were deemed as too confusing and produced too many segments for marketing managers to address effectively. Yet, in this era of flexible manufacturing, micro-niche targeting, and multi-channel direct marketing, many market planners now consider and use market segmentation schemes that support much finer targeting efforts.
The three-dimensional segmentation scheme similar to the one illustrated in Figure 1 was derived by the authors for a major B-to-B service company. Each segmentation dimension had a different set of basis variables. The X-axis was a benefits-based segmentation using derived importances from a conjoint exercise; the Y-axis was a segmentation based on buyers' perceived acceptable price range; and the Z-axis was based on clustering the responses to a battery of questions about customer priorities.
Each surveyed customer, now a member of one segment in each of the three segmentation schemes, was assigned to a single cell in the segmentation matrix. Thus respondents in each cell were very similar on all three dimensions and different from respondents in other cells on at least one set of basis variables.
This approach provided a much cleaner and more understandable segmentation scheme then had we tried to dump all three sets of measures into a single clustering effort.
This particular segmentation scheme had 275 cells. In general, these multidimensional segmentation schemes will have from 200 to 500 cells so large samples of at least 1200 or more are needed in order to get reliable statistics at the cell level. Even with very large samples, many cells may be sparsely populated; this, however, is acceptable as it indicates that some markets may be too small to be profitable and should be either aggregated with other market segments or dropped from consideration as a specific target.
Alone, this segmentation approach provides considerable insight into the marketplace structure. However, each cell of the segmentation scheme, along with means and distributions of all descriptor variables, can be put into a database and manipulated to provide a more dynamic understanding of the market structure and allow the user to re-form the cells into new segmentation schemes. With a well-designed segment manager program, the user can aggregate cells into specific market segments based on the varying needs of different internal functional and departmental users, while using a common base of homogeneous cells for all of the segmentation schemes in the company. Thus, any specific tactical segmentation scheme can be directly linked to the strategic segments or to any other tactical segmentation scheme.
Artificial Neural Networks
Starting in the early 1990's, artificial neural networks (ANN) have been developed to address a host of analytical problems. Both the appeal and the bane of ANN's is that they do not require any particular underlying model formulation and they do not require any particular data structure, as do, say, regression analysis, logit modeling or factor analysis.
Generally, ANN's are given a set of input variables and a set of known outcomes, and the algorithm is asked to find the best relationship between the inputs and the outputs. It does this by initially forming a trial relationship on a subset of the data, called the learning set or calibration set. The algorithm then backs up through one or more "hidden layers" of input junctures, or neurons, and adjusts the weight of each input to that neuron to maximize its contribution to accurately predicting the outcome. This learning procedure is repeated over and over for each neuron until the process is halted by user specifications, or there is 100% accuracy in the prediction of a separate test sample. Results are tested and validated with other samples.
There are some specialized neural networks that are designed to cluster cases of data. These fall in the class of unsupervised neural networks, meaning that the outcomes are not pre-specified. Typically, these algorithms attempt to form clusters based on minimizing variance around a specified set of "seeds" or based on optimizing a transform function. Currently, one of the best known of these clustering ANN's is the Kohonan Self-Organizing Map. All ANN's of this type require a large number of cases because they need a large learning sample, a large test sample, and a large validation sample.
Results have been mixed - some extremely good, others not so good. The usefulness of the clustering solution seems very dependent on the initial selection of seeds or the shape of the transform function. Many alternative runs may be necessary to find an acceptable solution.
One positive aspect of using ANN's to form clusters is that they tend to handle messy data well, that is missing variable data, variables with non-standard distributions, and variables using different scales.
Unlike cluster analysis, ANN's internally decide the relative impact, or weight, of an input variable on the results. Thus, it is difficult to externally weight any of the variables so that they have a higher influence on the clustering outcome.
Another issue with ANN's is that they can over-learn. That is, the iteration process may optimize the solution for the specific set of data being addressed, but those results cannot be generalized to an additional set of observations. Determining when to stop an ANN from learning is a problem that has not yet been fully solved.
Latent Class Models (Mixture Models)
Unlike other segmentation approaches, latent class is based upon statistical modeling, often involving dependent variable relationships characterized by regression and logit specifications. It assumes that data are generated by a mixture of distributions, and the analysis involves simultaneously estimating segment level models and determining segment identities. After the estimation process, individual respondents can be assigned into segments based upon their posterior probability of membership. For example, using only product selection choice data where respondents are never directly asked about brand, price, and features, a latent class analysis can reveal segments that are brand loyal, price sensitive, feature sensitive, etc. through an examination of the resulting coefficient estimates. In practice, the use of latent class analysis in conjoint and discrete choice applications has received much attention, and user-friendly software is now readily available. Cohen and Ramaswamy (1998) 3 cite two studies concluding that latent class conjoint was superior to several different segmentation applications to conjoint data in terms of fit, descriptive validity, and predictive validity. However, other investigations comparing latent class results with procedures that first cluster based on individual level response data, and as a second step develop models within the segments found little difference in the resultant size and membership of the two clustering solutions. However, the overall explained variance in the dependent variable, thus its predictive power, was greater with the LCM approach.
While latent class analysis offers some advantages over more conventional procedures, it requires assumptions and specifications that are not needed in traditional approaches. When dependence relationships are involved, the importance of that relationship in forming segments may not be sufficient for strategic and many tactical market segmentation efforts. This is true of any segmentation procedure utilizing dependent relationships such as CHAID and CART. However, the methods can be very useful for better understanding market structures.
Fuzzy and Overlapping Clustering
Most clustering algorithms are programmed so that all cases are assigned to one and only one cluster. That is, the algorithms require that the results be mutually exclusive and exhaustive. The basic idea in fuzzy (or overlapping) clustering is to allow a single case to be assigned to more than one cluster, or alternatively to assign a portion of a case to more than one cluster. Currently, there is no widely available software to handle this procedure, and there may be little need for it.
Most clustering routines assume cases are grouped into hyper-spheroids in multidimensional space. Cases are assigned to a cluster based on their multivariate distance from the center of the spheroids or based on their probability of belonging to each spheroid. In the situation where a particular case is nearly equal distant, or has nearly equal probability of belonging to more than one spheroid, the standard clustering program will assign the case to the closest one, even if it takes five decimal points to do it. Many statisticians and research methodologists believe that there should be an alternative for the clustering algorithm to assign the case to each of the clusters.
In theory, that sounds fine. Practice is a different story. The effect of such a procedure would be to increase the variance within each cluster, thus reducing the variance explained by clustering. Cluster homogeneity would suffer, cluster overlap would increase, and the resulting clusters would be much harder to explain because they would be less differentiated. It would seem better practice to throw these ambivalent cases out of the analysis. [See sidebar]
Throwing out cases that do not fit well is very controversial. However, I believe our objective in market segmentation, and the underlying clustering of cases, is to identify unique and differentiated markets, recognizing that some cases may be "fence sitters" between segments. Cases that depreciate the differentiation should be held out of the analysis. Thus, I see little need to further develop the concept of fuzzy or over-lapping clustering routines.
For other applications, there is no reason that cases cannot be duplicated in a data file prior to clustering such that the case represents two or more sets of measures for each variation of the case.
By way of an example, think about the situation where you may ask respondents to complete a conjoint trade-off task about their beer selection preferences in different situations, say, at a business social function and at a bar with a group of friends. The conjoint attributes and levels are identical, but respondents' resulting profile preference ratings may be different, based on the situation. If you independently derive importances for each attribute for each of those two occasions, you will get two sets of derived importances for each respondent. There is no reason whatsoever that you cannot subject both sets of derived importances for these respondents to a standard clustering routine. The same respondent may then show up in two different clusters, depending on the results from their situational preferences. Indeed, this is one method researchers use to address occasion-based segmentation as described in the next section.
Occasion-Based Segmentation
A particular challenge in market segmentation analysis is how to form segments when circumstances or occasions drive product preference and selection. For example, it is well known that beer brand preference and brand selection is often driven by the situational circumstances of the purchaser at the time of consumption. Restaurant selection is also well known to be dependent on occasion and circumstance.
Mechanically, this is not very difficult. All as it takes is a different way of looking at the data input file to standard clustering routines. A case becomes an occasion with individual respondent information appended to each occasion-case.
Here is an example. Let's say we are measuring the relative influence on brand choice of a set of brands, product attributes, and price variations for carbonated soft drinks (CSD's) for immediate consumption in a variety of store-type settings - grocery, convenience, mass merchandise, deli, and drug. Each respondent is asked to execute a point allocation of importance of each of the attributes, plus price and brand name, on influencing their selection for each store setting that they have experienced in the last 10 days. In addition, we ask demographic and consumption volume profile information to better describe the respondent.
We need to construct the data file as shown below, showing the first two respondents.
Occasion 1 measures
|
Respondent 1 profile data
|
Occasion 2 measures
|
Respondent 1 profile data (duplicated)
|
Occasion 3 measures
|
Respondent 1 profile data (duplicated)
|
Occasion 1 measures
|
Respondent 2 profile data
|
Occasion 3 measures
|
Respondent 2 profile data (duplicated)
|
Occasion 5 measures
|
Respondent 2 profile data (duplicated)
|
Here, each set of point allocation data for each store setting becomes a case. The respondents' profiling data is appended to each set of occasion ratings.
At this point we have two choices. We could execute a clustering of the point allocation data for each type of shopping trip, thus deriving segments based on importance drivers within store type, separately. Alternatively, we could submit all of the point allocation data to a clustering algorithm and find clusters or segments where the importance drivers are similar within each cluster and different between clusters, regardless of the occasion. The resulting clusters may or may not differentiate between store types. Either way, we have executed an occasion-based segmentation.
Speculations on the Future of Market Segmentation Research
It seems that the future for market segmentation research is rather rosy from the demand side. Market segmentation has taken on an increasingly important role in business strategy development. Thus, senior management is demanding more segmentation research as a critical input to the strategic planning process.
Our ability to accumulate and manage massive amounts of data on customers and potential customers, aligned with the availability of more flexible manufacturing capabilities, more targeted communications capabilities, and multi-channel delivery systems would seem to assure that there will be increasing demand for much more, and much finer identification of target markets in most product and service categories. The accelerating use of the Internet opens up even greater possibilities for target marketing to ever-smaller segments.
There are a few down sides. The need for isolating and defining ever-smaller target markets will require larger research sample sizes and a commensurate increase in the costs of doing excellent market segmentation research. Samples must be pristine and projectable to the larger population from which they were drawn.
This same demand for finer targeting will force more researchers into the complexities of multidimensional segmentation and occasion-based segmentation. These procedures require more time for analysis and reporting, and they require improved methods for delivering and managing results, and the need for leveraging database-reporting capabilities.
Artificial neural networks and latent class models will continue to supplant many traditional segmentation algorithms. These require increased methodological and statistical training for their proper and effective use.
The anticipated changes indicate that the implementation of a segmentation strategy will get much more complex for both marketers and researchers. But the rewards will be better customer retention, more efficient marketing, and higher profitability.
SIDEBAR: Finding Outliers and Fence Sitters
Outliers are isolated cases that are not near any cluster centroid. Fence Sitters are cases that are nearly equal distant from two or more cluster centroids or have nearly equal probability of belonging to more than one cluster. Both outliers and fence sitters distort measures of variance explained, cluster homogeneity measures, and distance measures between centroids. A few outliers or fence sitters can make a "good" clustering solution look like a "bad" one. The key is to identify them and throw them out of the analysis.
There are several ways to identify outliers and fence sitters. One is to calculate the multivariate distance from each case to each cluster centroid. For outliers, find the closest centroid, and determine if that case is within some acceptable range of the centroid, say 2.5 standard deviations. If not, eliminate the case.
For fence sitters determine if the case's distance to the closest centroid exceeds its distance from the next closest centroid by some percentage, say 10%. If not, eliminate that case.
Then re-cluster the remaining cases.
Perhaps an easier way to identify both outliers and fence sitters is the following procedure:
* Pick your "best" cluster solution of K groups.
* Conduct a K-group discriminant analysis where each cluster is a discriminant group and the clustering basis variables are the independent variables in the discriminant model.
* Have the discriminant analysis software print out a file of case assignments and probabilities of group membership.
* For the cases assigned to each cluster, rank order cases by the "probability of group membership" to that cluster.
* Throw out cases in the lower 10% or 15% of probabilities.
* Re-cluster and re-tab remaining cases.
In either procedure it's always a good idea to take the thrown out cases and separately re-cluster those just to make sure you have not inadvertently thrown out a meaningful cluster that was hidden in the outliers and fence sitters.
End Notes
1. Much of the material in this article is taken from the author's Chapter 13 on market segmentation in Marketing Research: State of the Art Perspectives, edited by Chuck Chakrapani, American Marketing Association/Professional Marketing Research Society, 2000. ISBN 0-87757-283-6.
2. This discussion was extracted from the article by William Neal titled "Multidimensional Segmentation" published in the Spring issue of the Canadian Journal of Marketing Research.
3. Cohen and Ramaswamy, "Latent Segmentation Models: New Tools to Assist Researchers in Market Segmentation", Marketing Research, Vol. 10, No. 2, p 15-21 (Summer), American Marketing Association
|